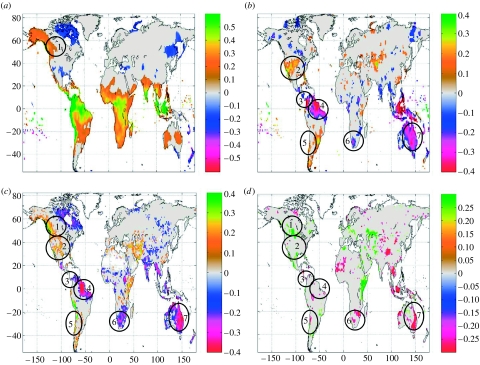
Figure 2.
ENSO responses shown as regression gradients between climatic index (figure 1) and selected variables. Positive values indicate increases during the warm ENSO phase and the reverse during the cool phase. Only geographical areas where there is equal to or greater than a 95% probability of repeat occurrence in ENSO events are shown. Gradient responses are shown for yearly (a) temperature, (b) precipitation, (c) gross primary production (GPP) and (d) NDVI. Circles with numbers indicate areas considered in the discussion.

