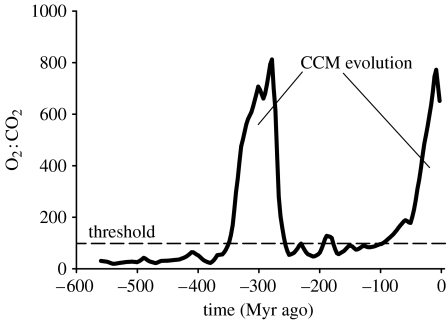
Figure 8.
Changes in the atmospheric O2 : CO2 ratio over the Phanerozoic. The peak at 300 Myr ago coincides with the evolution of vascular plants. Horizontal dashed line indicates O2 : CO2 ratio of 100 estimated by von Caemmerer & Furbank (1999) as the selection pressure threshold for developing a CCM. The O2 : CO2 ratios were calculated from Falkowski et al. (2005) and Berner (2006) (see part IV of the electronic supplementary material).

