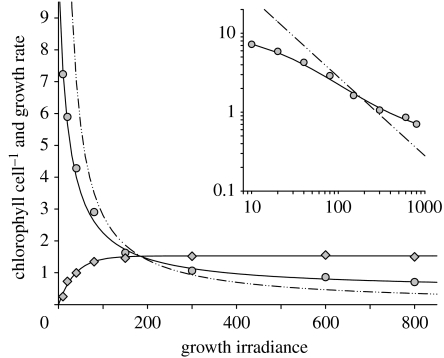
Figure 9.
Cellular chlorophyll concentration (pg cell−1; circles) and growth rate (divisions d−1; diamonds) of Dunaliella tertiolecta acclimated to a range of growth irradiance (Ig) levels (μmol quanta m−2 s−1). Dot-dashed line is 1/Ig scaled for comparison with chlorophyll data. Inset is same chlorophyll data as the main figure except with log-log axes to better show deviation between acclimated chlorophyll values and the 1/Ig relationship. Cells were grown under constant light in nutrient-replete (F/2) medium.

