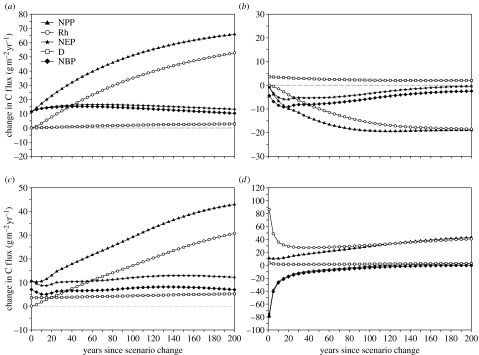
Figure 5.
Landscape C flux responses to changes in: (a) +20% growth rates, (b) +20% disturbance rates, (c) +20% growth and disturbance rates and (d) +20% growth, decomposition and disturbance rates for a 100 000 ha hypothetical boreal forest landscape, showing a change in NPP, Rh, NEP, direct disturbance losses (D) and NBP relative to before scenario change.

