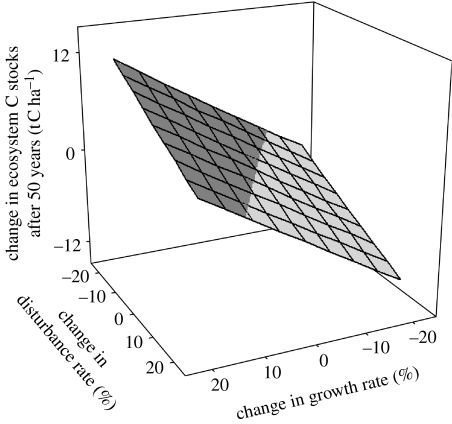
Figure 6.
Response surface showing a change in ecosystem C stocks after 50 years in scenarios with growth/disturbance rate changes and decomposition rates at base levels. Each intersection of lines on the surface represents the outcome of 1 out of the 81 scenarios that were simulated. The dark grey portion of the surface has a positive change in ecosystem C stocks after 50 years (C sink). At the centre of the surface is the base scenario, which is C neutral (i.e. no change in C stocks). The front left-hand corner of the surface shows the outcome of the +20% growth with +20% disturbances scenario to be positive (C sink) after 50 years. The best possible outcome (greatest C sink) is realized with the +20% growth with −20% disturbances scenario.

