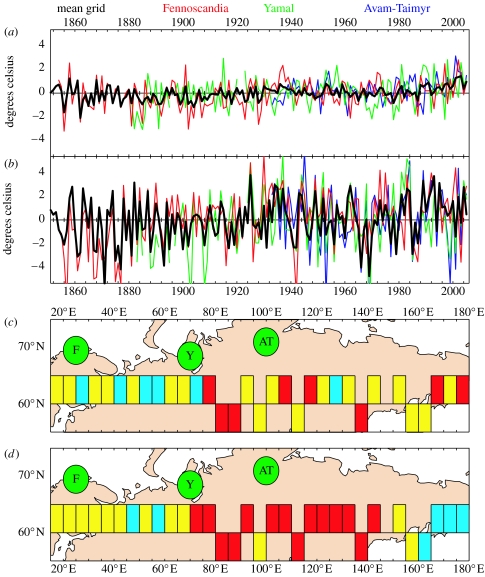
Figure 1.
High-latitude Eurasian instrumental seasonal temperature series for: (a) summer, the mean of June to August and (b) winter, the mean of December to February. The thick black line indicates the average of monthly land air temperature data for the thirty-five 5°×5° grid boxes (Brohan et al. 2006) listed in appendix A. The data are anomalies from the 1961 to 1990 period mean. Individual grid box data representing Fennoscandia (62.5° N, 22.5° E), Yamal (62.5° N, 67.5° E) and Avam–Taimyr (62.5° N, 102.5° E) are also shown. Temperature trends for (c) summer and (d) winter for the period 1950–1994 (calculated from standardized instrumental anomaly data) for individual 5°×5° average grid box series listed in appendix A. The sign and magnitude of the trends are indicated by colour coding. The only significant trends (p>0.05) are positive (i.e. greater than 0.015 as per the scale of figure 2). The green circles show the approximate source regions of tree-ring chronology data (table 1) described in this paper: F, Fennoscandia; Y, Yamal; AT, Avam–Taimyr.

