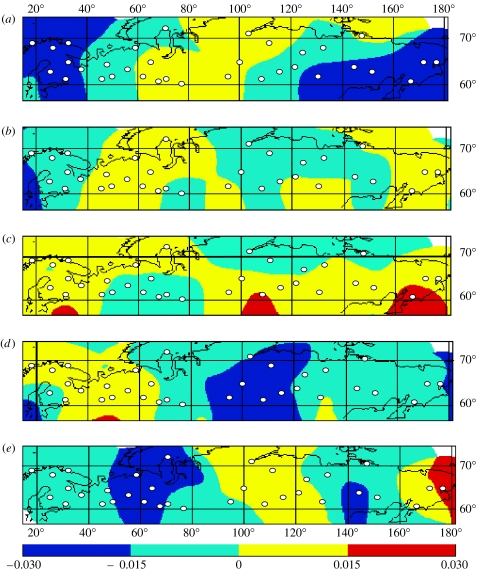
Figure 2.
The spatial distribution of trends in a number of growing-season-related temperature parameters: (a) the start of the growing season; (b) the end of the growing season; (c) the growing degree day sum greater than 5°C within the growing season; (d) the number of frost days in the growing season and (e) the timing of maximum temperature. All data refer to the period 1950–1994 and are based on the 34 meteorological station records (shown as white dots: see appendix A for details) distributed across northern Eurasia. The trend data are normalized and colour coded so that dark blue and red indicate trends that are significant at the 95% level.

