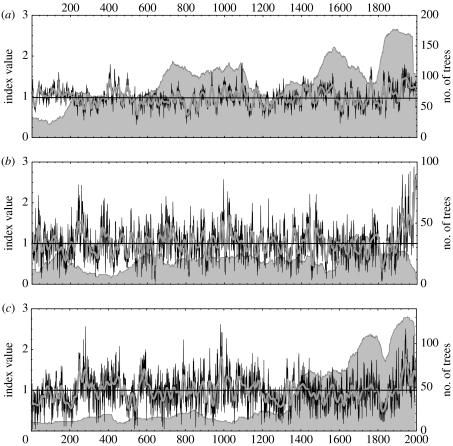
Figure 3.
Regional curve standardized (RCS) chronologies (thin lines) and smoothed chronologies, the sum of the first three components of singular spectrum analysis of each RCS chronology (thick lines), for the regions: (a) Fennoscandia, (b) Yamal and (c) Avam–Taimyr. The grey shading represents the changing number of samples that go to make up the chronology through time.

