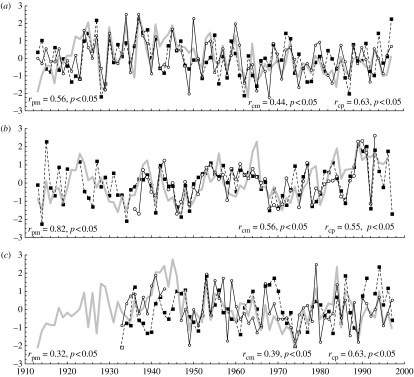
Figure 7.
Variability of local cumulative pentad temperature data (black solid line), monthly mean grid box temperature data (black dashed line) and RCS tree-ring indices (thick grey line) for different regions: (a) Fennoscandia (temperature data are either the sum of Abisko consecutive pentads from number 38 to 46 or monthly means of July and August); (b) Yamal (Hoseda-Hard pentads from 27 to 37 and monthly mean for June and July) and (c) Avam–Taimyr (Hatanga pentads from 34 to 38 and monthly mean for July). All data were standardized by subtraction of the mean and division by the standard deviation over the period common to both temperature and tree-ring indices. Simple correlations between chronology and monthly mean temperatures (rcm) and between chronology and cumulative pentad temperatures (rcp), along with their significance levels are shown in the lower right of each box. Correlations between the monthly mean and cumulative pentad data (rpm) are given in the lower left. All correlations are significant at the 95% level.

