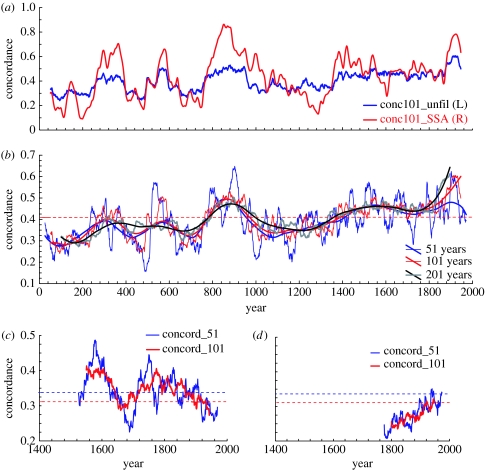
Figure 8.
(a) Kendall's concordance coefficients calculated for overlapping 101-year windows using the RCS chronologies of Fennoscandia, Yamal and Avam–Taimyr, as SSA-filtered data (red line) and unfiltered data (blue line); (b) concordance coefficients for the unfiltered RCS chronologies calculated for moving windows of 51, 101 and 201 years, and the same data smoothed using the negative-exponential weighted least-squares method; (c) concordance coefficients for windows of 51 and 101 years comparing the mean of June and July mean monthly temperatures for three regions (equivalent to the sources of the three chronologies) as simulated by HadCM3 for 500 years under ‘natural’ forcings and (d) the equivalent concordance values using the same regional temperatures extracted from a 250-year experiment under combined natural and anthropogenic forcing (the ‘all forcings’ experiment). Significance levels (p=0.05) shown as dashed lines on (b–d).

