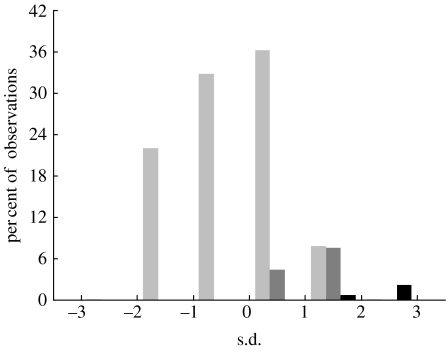
Figure 9.
Distribution of (standardized) concordance coefficients (mean=0.40, s.d.=0.08) between the RCS chronologies of Fennoscandia, Yamal and Avam–Taimyr (derived for 101-year moving windows) and separated into three time periods with windows centred on AD 51–1899 (light grey bars) excluding 764–960 (dark grey bars) shown separately and 1900–1946 (black bars).

