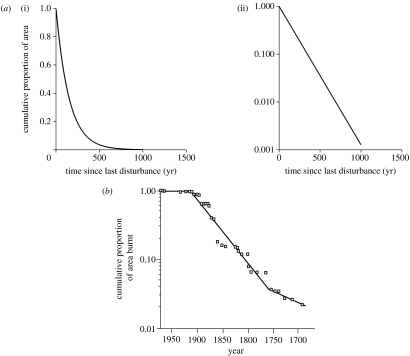
Figure 10.
(a(i)) Example of exponential curve found to fit best most time-since-fire distributions (survivorship). A(t)=e−(t/b), in which A(t) is the survivorship distribution; t is the time since last fire; and b is the fire cycle, defined as the time required to burn an area equal in size to the study area. It starts with the landscape unburned and describes the proportion remaining at different ages. (a(ii)) Semi-log time-since-fire distribution showing a straight line. (b) Time-since-fire distribution for the Boundary Waters Canoe Area (source: Heinselman 1973) indicating two changes in fire frequency (i.e. mixed distributions).

