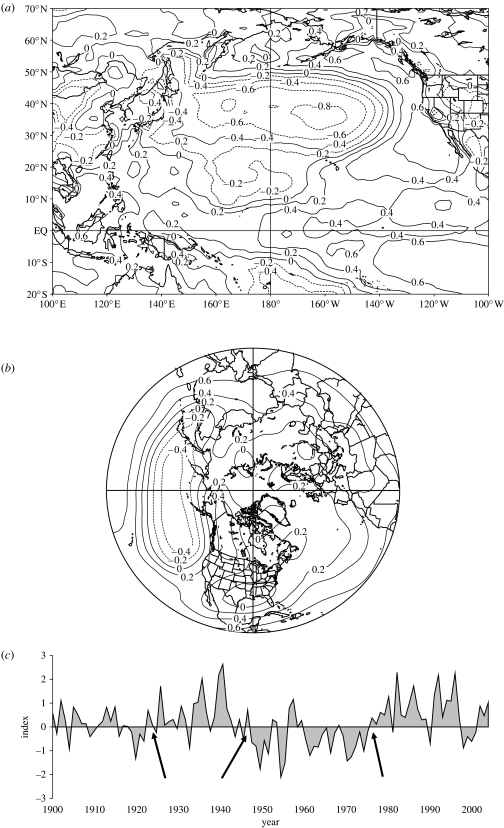
Figure 6.
The Pacific Decadal Oscillation (PDO). (a) Chart showing point correlations between Northern Pacific Ocean Sea Surface Temperatures (SST) and the PDO Index, based on spring–summer (March–August) anomalies. Contour interval is 0.2. Note the most prominent patterns of positive PDO—high temperatures in front of the northwestern coast of North America and in the Gulf of Alaska, and low temperatures in the central North Pacific Ocean. Data and software for the figure obtained from the NCEP/NCAR Reanalysis Project (Kalnay et al. 1996). (b) Chart showing point correlations between Northern Hemisphere 500 hPa height and the PDO index, based on spring–summer (March–August) anomalies. Contour interval is 0.2. Note the most prominent patterns of positive PDO—highs over western North America and lows in the Gulf of Alaska. Also, note its similarity to the PNA pattern. Data and software for the figure obtained from the NCEP/NCAR Reanalysis Project (Kalnay et al. 1996). (c) Spring–summer PDO index obtained from the Joint Institute for the Study of the Atmosphere and Ocean (JISAO; http://tao.atmos.washington.edu/). Note the regime shifts in 1924, 1947 and 1976/1977 (arrows).

