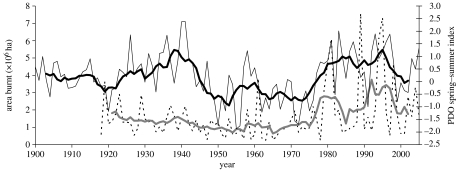
Figure 8.
Forested area burned in Canada, 1918–2005 (dashed line); spring–summer PDO index, 1900–2005 (continuous line). Thick lines represent the 7-year running means in order to highlight low frequency variability (black, PDO; grey, area burned). Note the overall high similarity between both series at low frequencies.

