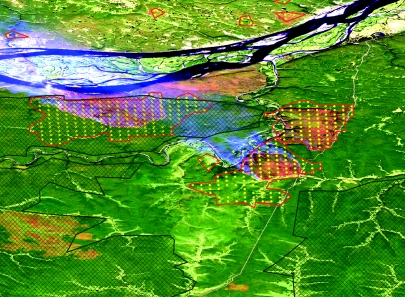
Figure 3.
Example of fire events. The approximate size of the displayed image is 50×30 km on the ground. The background image is from the ETM+(Enhanced Thematic Mapper) sensor of Landsat-7 satellite (30 m resolution) recorded on July 2002. On such a colour composite, forest areas appear in green, non-forest areas in light tones (tundra, bogs or swamped grasslands), water in blue (Lena river) and burned areas in reddish brown. Active fires were present at the time of the image acquisition with smoke plumes visible in white blue. The ‘intact forest landscape’ areas are displayed as polygons in green. Yellow dots indicate the centre of forest fire-affected pixels (originally in a grid at 1 km resolution in sinusoidal projection). Polygons in red delineate single fire events, i.e. are regroupings of fire dots with contiguous dates. In the study, the largest fire event (left side of the image) is considered as a fire event inside intact forests although it started from the river bank and may probably not have a natural origin.

