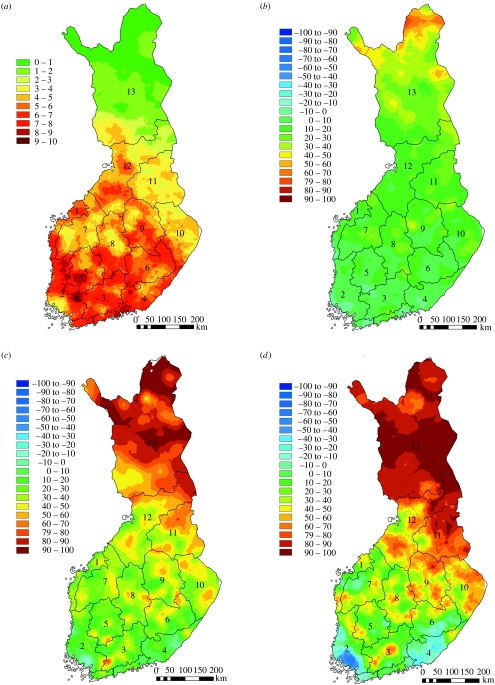
Figure 7.
Integrated growth of all tree species under the current climate, and the change in growth under climate change: (a) total current growth (m3 ha−1 yr−1); percentage of total growth change for (b) 1991–2020, (c) 2021–2050 and (d) 2070–2099. The numbers on the maps refer to the Finnish Forest Centres.

