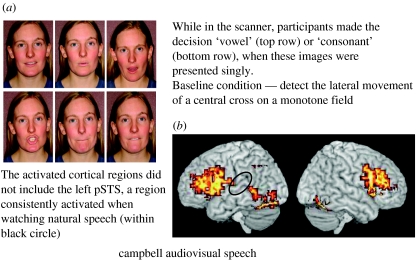
Figure 1.
(a) Speech images used in the fMRI experiment reported by Capek et al. (2005). Vowels are shown in the top row and consonants in the bottom row. (b) Rendered group activation maps for the task of distinguishing vowel and consonant lip shapes. Images were presented singly for decision. The baseline task was to detect the movement of a cross on a blank background (Capek et al. 2005). pSTS (black circle) was not activated. Significant foci of activation (x, y, z, coordinates) included: (i) inferior temporal cortex/fusiform gyrus (−29, −78, −17), (ii) right inferior frontal cortex extending into dlpfc (47, 11, 26), (iii) left inferior frontal cortex extending into dlpfc (−47, 7, 33), (iv) left inferior parietal lobule (−25, −63, 43), and (v) caudal anterior cingulate gyrus (−3, 11, 50).

