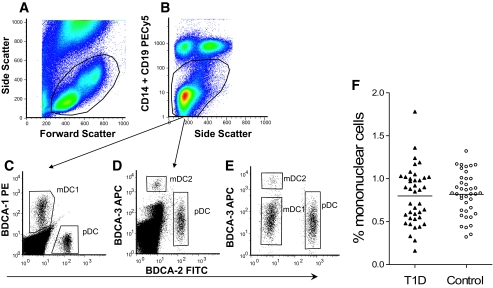
FIG. 1.
Example of flow cytometry analysis and gating strategy for identification and quantification of blood dendritic cell subsets. The mononuclear cell population in whole blood is identified by a combination of forward and side scatter properties (A) followed by exclusion gating of live CD14+ and CD19+ mononuclear cells and dead cells (B), before the identification and enumeration of plasmacytoid dendritic cell (pDC), myeloid dendritic cell 1 (mDC1), and myeloid dendritic cell 2 (mDC2) subsets, as shown in C–E with the relevant blood dendritic cell (BDC) marker. F: Total dendritic cell populations as a percentage of mononuclear cells in 40 patients with new-onset type 1 diabetes and matched control subjects. (Please see http://dx.doi.org/10.2337/db08-0964 for a high-quality digital representation of this figure.)

