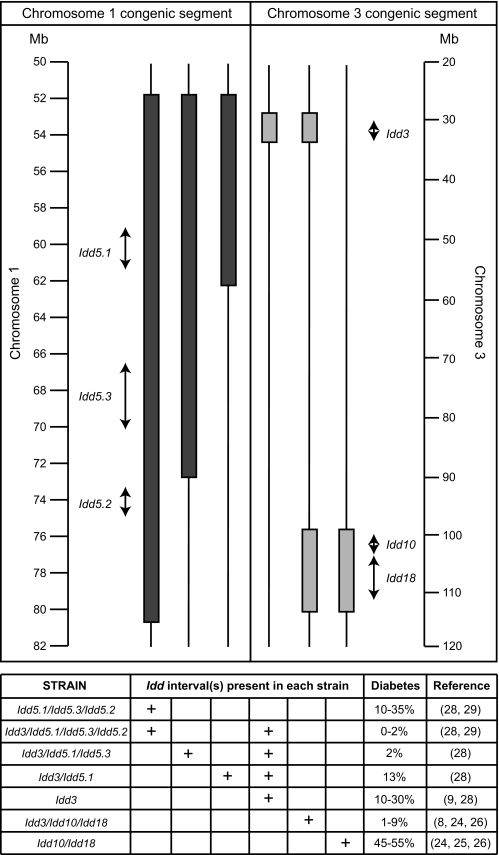
FIG. 1.
Schematic representation of candidate gene interval and chromosomal location. The filled bars represent B10-derived or B6-derived congenic segments on chromosomes 1 and 3, respectively. The arrows represent the size of each Idd interval as previously defined using additional congenic strains of mice: Idd3 (650 kb) (ref. 9), Idd10 (950 kb) (ref. 48), Idd18 (4.0 Mb) (ref. 29), Idd5.1 (2.1 Mb) (ref. 30), Idd5.2 (1.52 Mb) (ref. 30), and Idd5.3 (3.6 Mb) (ref. 31). The “diabetes” column indicates the percentage of females developing diabetes by 7 months of age. Where a range is indicated, this summarizes the results of a number of frequency studies performed over many years.

