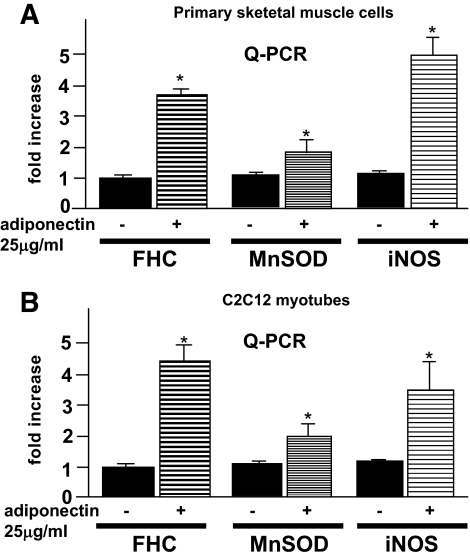
FIG. 6.
FHC, MnSOD, and iNOS mRNA levels in primary skeletal muscle cells (A) and C2C12 myotubes (B) were determined by quantitative PCR using an ABI PRISM model 7000 according to the manufacturer's instructions. Each column shows the mean ± SE obtained from four samples in the presence or absence of adiponectin. *Significant difference (P < 0.05) relative to control cells in the absence of adiponectin.

