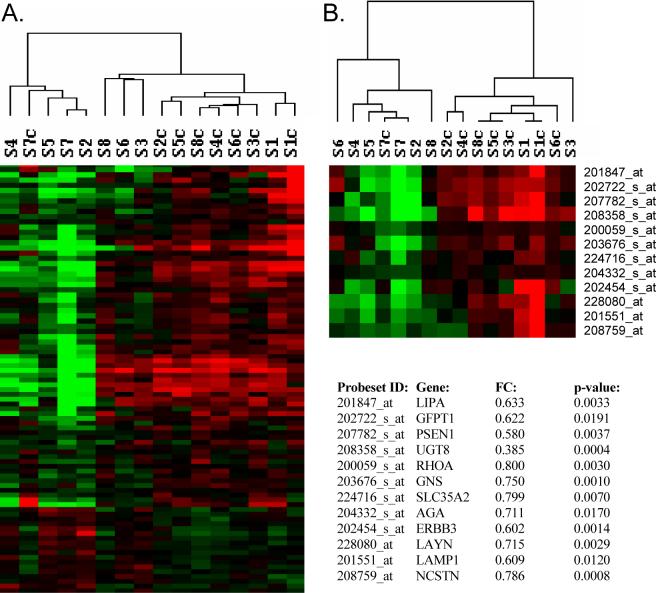
Figure 1.
Hierarchical clustering of gene expression changes. Heatmaps show the top differentially expressed genes at p<0.05, (A), and p<0.01, (B), in schizophrenic subjects with short-term illness and their controls. Log2-transformed expression values were subjected to two-dimensional hierarchical clustering as shown above the heatmaps. Each colored pixel represents an individual gene expression value from a single subject. Relative decreases in gene expression are indicated by green and increases by red. Schizophrenic subjects: S1-S8 and their controls, S1c-S8c, are shown. FC, fold-change. The top 12 differentially expressed genes are shown as indicated by their UniGene gene symbol.

