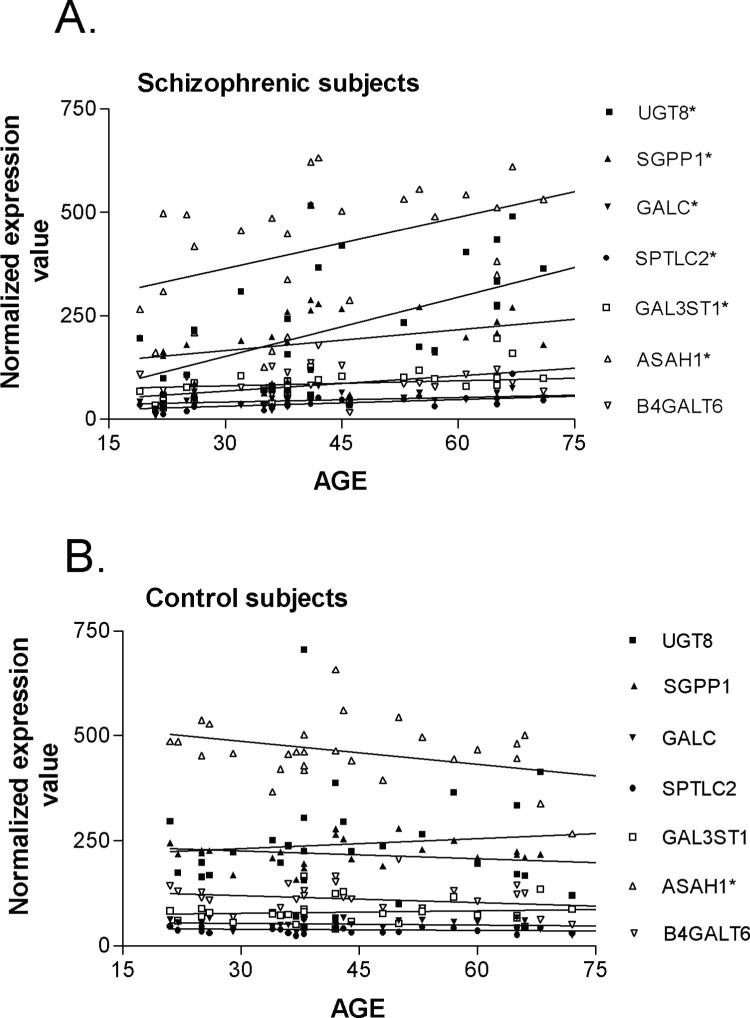
Figure 4.
Correlations between the expression of sphingolipid genes and age in schizophrenic subjects (A) and controls (B) for the indicated genes. Each data point represents a normalized expression value for an individual subject. Pearson Product Moment correlations were performed as described in Methods. Asterisks indicate a significant effect with age.

