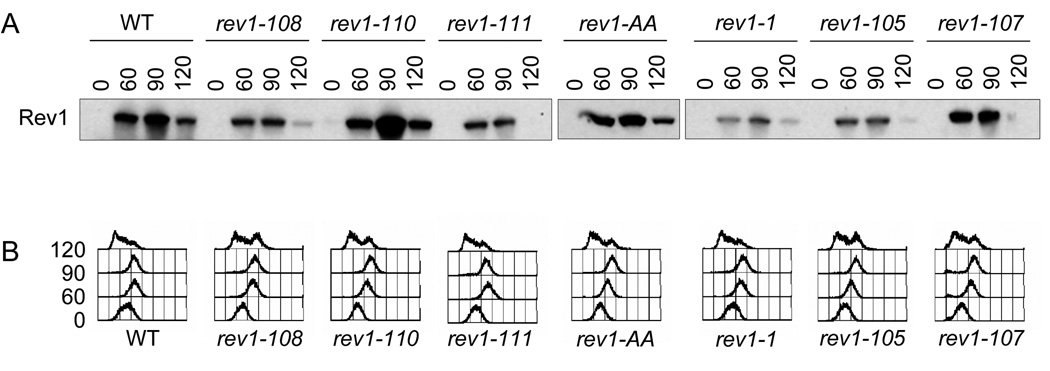
Fig. 5.
Rev1 protein levels expressed by the chromosomal rev1 mutants during the cell-cycle. (A) Immunoblot analysis using the protein A epitope tag to visualize the WT and indicated mutant Rev1 protein levels throughout the cell cycle. The membrane was stained with Ponceau-S prior to immunoblotting to confirm equal loading. (B) FACS profiles of time points after α-factor release showing progression through the cell cycle.

