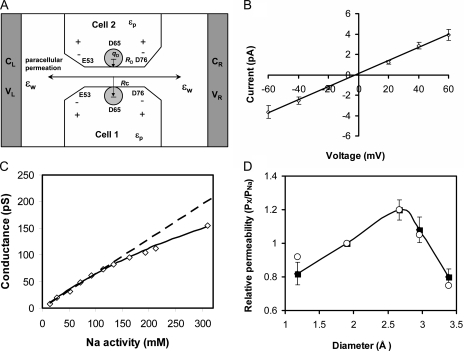
Figure 11.
Brownian dynamics modeling of the claudin-2 pore. (A) Model of the WT claudin-2 pore. E53 and D76 are positioned near the pore entrances. Residue D65 is placed in the middle and represented by a charged sphere characterized by its size RD, charge qD, and the distance between the pore centerline and the sphere center, RC. (B) Current–voltage relationship obtained in symmetric 150 mM NaCl. Open symbols with error bars represent numerical simulation data. (C) Conductance–concentration profile obtained from simulations with symmetrical NaCl concentrations up to 450 nM. Data points within the experimental range (up to a Na+ activity of 113 mM or concentration of 150 mM) are fit by a dashed line. The solid line shows a curve fit of the entire dataset to the Michaelis-Menten equation: G = Gmax/(1 + Nas/[Na]), where Gmax = 450 pS and Nas = 600 mM. (D) Alkali metal cation selectivity (displayed as permeability relative to that of Na+) determined by the biionic potentials obtained in our numerical simulations (shown as filled squares with error bars). For comparison, the experimental values (from Fig. 7 A) are shown as open circles.

