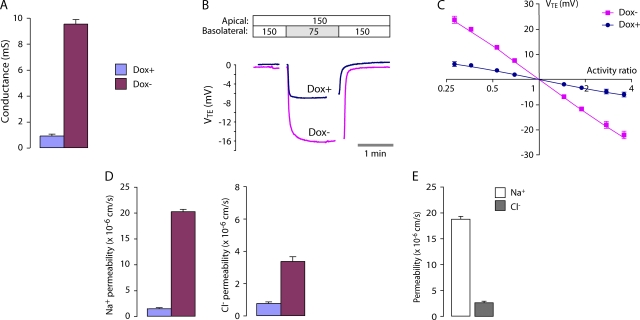
Figure 4.
Conductance and NaCl permeability of the WT claudin-2 pore. (A) Transepithelial conductance in MDCK I TetOff cells that were either uninduced (Dox+) or induced to express WT claudin-2 (Dox−). Columns show mean ± SE (n = 3 monolayers in a single experiment) and are representative of four independent experiments. (B) Raw voltage traces, VTE (apical with reference to basolateral), acquired in a typical NaCl dilution potential experiment. The NaCl concentrations of the Ringer solutions on each side of the monolayers are shown at the top (in mM). Gaps in acquisition occurred during solution exchange. (C) Determination of relative permeability from NaCl dilution potentials. The transepithelial diffusion potential, VTE, was determined at different NaCl activity ratios (apical activity/basolateral activity) and plotted on a log-linear scale. Data were fit by nonlinear regression to the Goldman-Hodgkin-Katz equation with best-fit values (95% CI) for PNa/PCl of 1.5 (1.4–1.6) for Dox+ and 6.3 (5.7–6.8) for Dox−. (D) Permeability to Na+ and Cl− in Dox+ and Dox− cells, determined from dilution potential measurements (see A for color code). (E) Apparent permeability of the claudin-2 pore to Na+ and Cl−, determined by subtracting measurements in Dox+ cells from those in Dox− cells.

