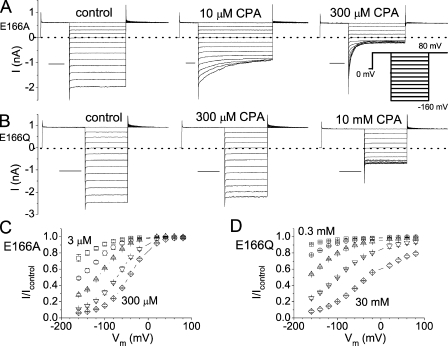
Figure 1.
Inhibitions of the E166A and E166Q mutants by CPA. (A and B) Macroscopic current recordings in the absence (left) and presence (middle and right) of the indicated concentration of CPA for E166A and E166Q mutants. (Inset) Voltage protocol used to obtain the recording traces. Horizontal scale bars represent 50 ms. (C and D) Percentage of current inhibitions at different voltages in various concentrations of CPA. For the E166A mutant, the current inhibition curves from left to right were obtained in the presence of 3, 10, 30, 100, and 300 μM CPA. For the E166Q mutant, the inhibition curves from left to right were in the presence of 0.3, 1, 3, 10, and 30 mM CPA.

