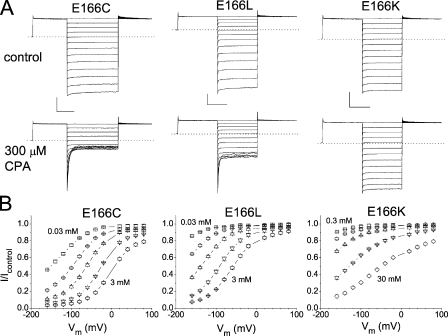
Figure 2.
Inhibition of the E166C, E166L, and E166K mutants by CPA. (A) Macroscopic current recordings of these mutants in the absence (top) and presence (bottom) of 0.3 mM CPA. The horizontal and vertical scale bars in each mutant are 50 ms and 1 nA, respectively. (B) Percentage of current inhibitions at different voltages in various concentrations of CPA. [CPA] was (in mM): E166C: 0.03, 0.1, 0.3, 1, and 3; E166L: 0.03, 0.1, 0.3, 1, and 3; and E166K: 0.3, 1, 3, 10, and 30.

