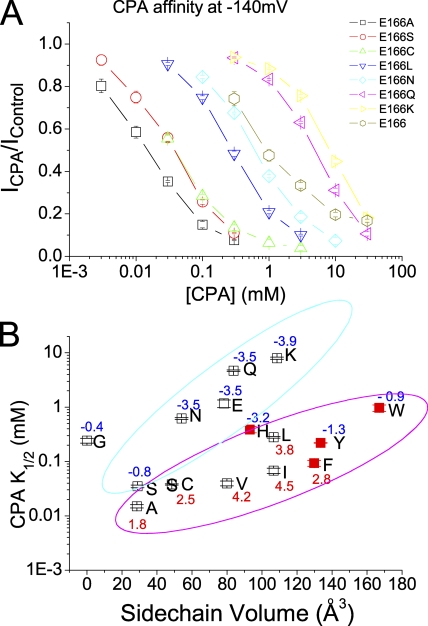
Figure 3.
Steady-state CPA-blocking affinities of various mutants of E166. (A) CPA dose-dependent inhibition curves of the wild-type (E166) and seven mutants. (B) Relationship between the apparent K1/2 of CPA and the side chain volume of the amino acid placed at position 166. The K1/2 value in each mutant was obtained by fitting the dose-dependent curve shown in A to a Langmüir equation (Eq. 1). The x axis represents the side chain volume of amino acids (Zamyatnin, 1972). The number associated with each data point in the plot is the hydrophobicity index of the introduced amino acid (Kyte and Doolittle, 1982). Except for the E166G mutant, all data points were classified into two groups as judged by eyes, and the two groups were enclosed in cyan and magenta circles, respectively. Notice that in comparison with the octanoate affinities shown in Fig. 12, the K1/2's of E166H, E166Y, E166W, and E166F (red squares) are disproportionally smaller than those of the other mutants.

