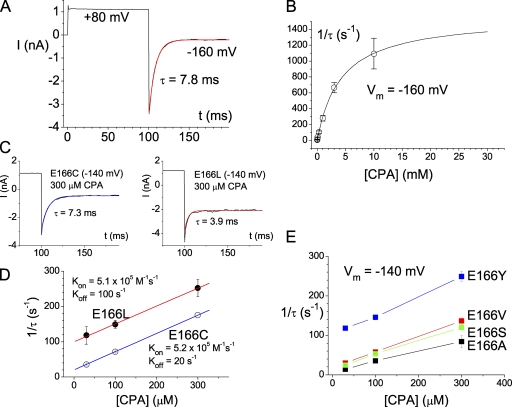
Figure 4.
Kinetics of the CPA block in the high CPA-sensitive mutants. (A) Single-exponential time course of the CPA inhibition. The recording trace was made from the E166A mutant in the presence of 300 μM of intracellular CPA. (B) Dependence of the CPA inhibition rate on [CPA]. The inverse of the time constant of the current inhibition upon stepping the voltage from +80 to −160 mV (as shown in A) was plotted against [CPA]. The solid curve was a best fit to a hyperbolic equation with Kd = 4.3 mM, and the saturated value of 1/τ = 1561 s−1. (C and D) Analysis of the on and off rates of the CPA block in the E166C and E166L mutants. The current inhibition time courses at −140 mV in these two mutants were fitted to a single-exponential function, and the inverse of the time constant (1/τ) was plotted against [CPA]. Only data points obtained in the presence of 300 μM or less were used to fit to a linear equation (Eq. 3). (E) Dependence of the CPA inhibition rate on [CPA] in various mutants of E166 that show relatively high CPA affinities.

