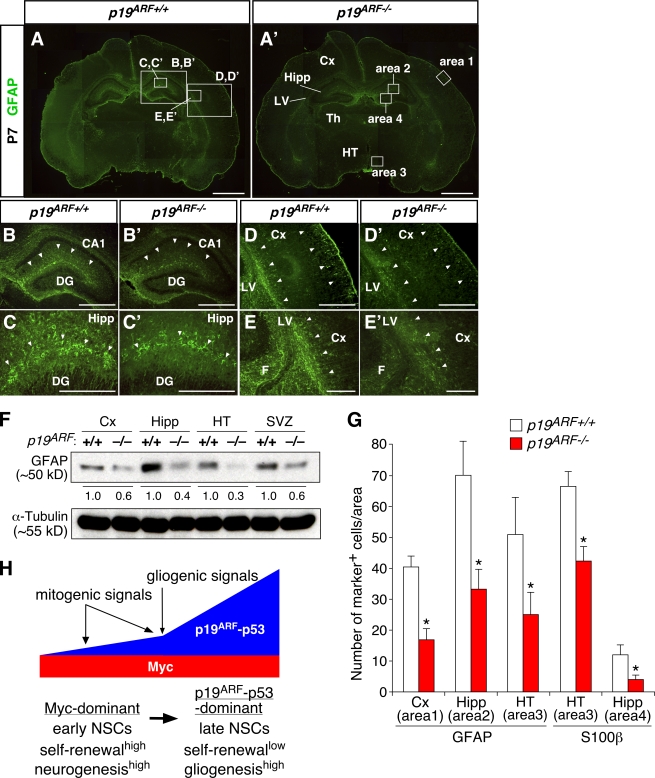
Figure 8.
Attenuated astrocyte differentiation in early postnatal brains of p19ARF mutants. (A–E′) GFAP staining of the WT (p19ARF+/+) and p19ARF−/− brains at P7. B–E′ show higher magnification views of the areas indicated by boxes in A. Differential staining patterns between the WT and mutant are highlighted by arrowheads. (F) Expression level of GFAP in various regions of p19ARF+/+ and p19ARF−/− mice. The level of GFAP proteins in the mutant relative to the WT (designated as 1.0) is indicated. (G) Comparison of the numbers of GFAP+ and S100β+ astrocytes in specific regions of the brain. The locations of areas 1–4 are indicated by boxes in A′. (H) Model for the actions of Myc and the p19ARF–p53 pathway in developmental control of NSCs. Arrows at the top indicate stimulation, and the thick horizontal arrow indicates transition from early- to late-stage cells. *, P < 0.01 compared with the WT. CA1, hippocampal CA1 sector; Cx, neocortex; DG, dentate gyrus; F, fimbria; Hipp, hippocampus; HT, hypothalamus; LV, lateral ventricle; Th, thalamus; SVZ, subventricular zone. Error bars indicate mean + SD. Bars: (A and A′) 1 mm; (B, B′, D, and D′) 500 μm; (C, C′, E, and E′) 200 μm.

