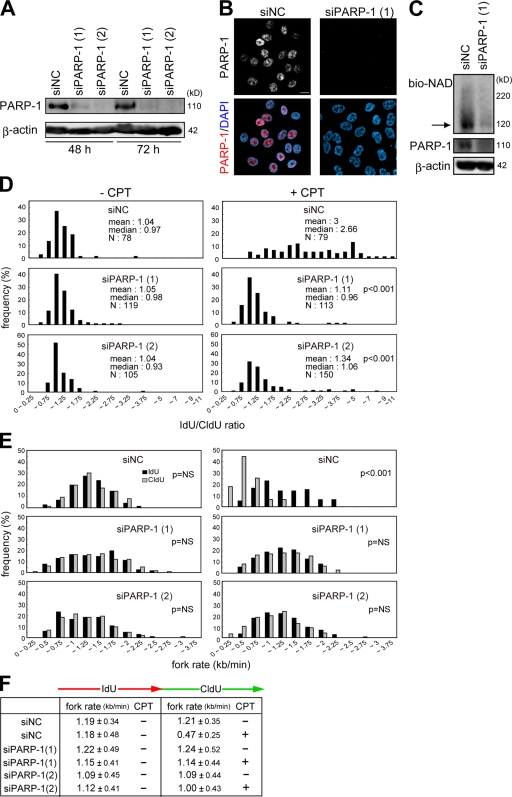
Figure 3.
Effects of PARP-1 knockdown on kinetics of replication forks. (A and B) Evaluation of PARP-1 knockdown in HeLa cells. The amount of PARP-1 in cells transfected with two different siRNA duplexes against PARP-1 and negative control siRNA (siNC) was evaluated by Western blotting (A) and immunofluorescence (B). β-Actin was used as a loading control. (C) Poly-ADP ribosylated proteins were detected as shown in Fig. 1 B. The arrow indicates the molecular mass of PARP-1. (D) Distribution of the ratio of the rate of fork progression in cells transfected with each siRNA. (E) Distribution of the rate of fork progression during IdU and CldU pulse labeling in cells transfected with each siRNA. (F) The tabular data are mean fork rates for each cell treated as indicated. The mean rates were calculated from the data described in E. Bar, 10 μm.

