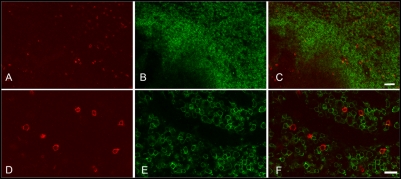
Figure 8. Localization of SIV-specific T cells and CD4+ T cells in lymph node.
In each set of panels, the left images (A and D) show Mamu-A*01 Gag181–189 CM9 tetramer staining (red), the middle images (B and E) show CD4 antibody staining (green), and right images (C and F) are merged images of the left and middle images. Images are from a genital lymph node of animal #28850. Confocal images collected using a 20× objective (A to C) and 60× objective (D to F). Bars: (A to C) 50 microns, (D to F) 20 microns.

