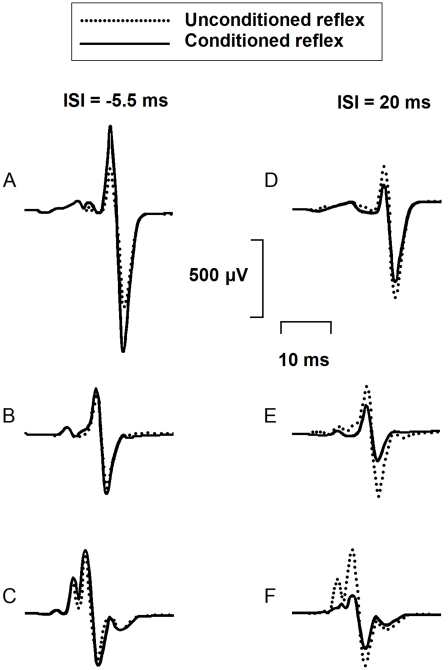
Figure 2. Effects of femoral nerve stimulation on soleus H reflex Averaged soleus EMG responses on the paretic side (A, D) and on the non-paretic side (B, E) of a stroke participant (#10, Table 1) and on the right side of a control participant (C, F) are presented at two different ISIs (−5.5 ms on the left side of the figure and 20 ms on the right side).
Dotted lines are control H reflex (without FN stimulation), continuous lines are conditioned H reflex. Each trace represents the average of twelve EMG responses. Size of the control H reflex was at 20% of the size of the maximum M response in both participants.

