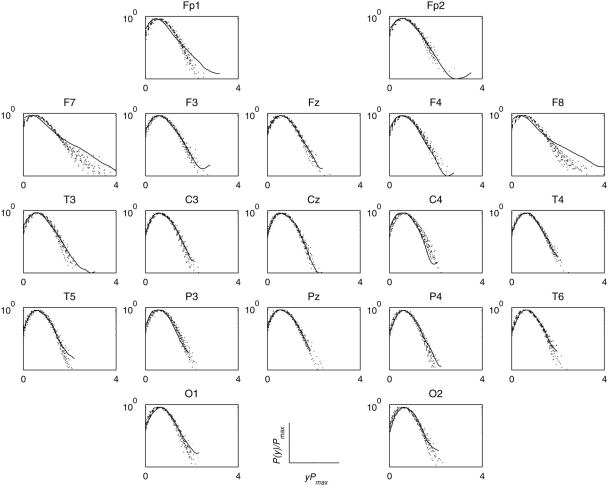
Figure 7. Surrogate analysis during visual perception.
Rescaled pdfs (in the semi-log scale) of the envelope of wavelet transformed coefficients at scale a = 18 for multivariate EEG signals recorded from 19 scalp locations from a participant (Vp.483) during looking at a painting and for the set ( = 19) of surrogates. The originals were shown in solid line and the surrogates in dotted lines. The long tail of the original pdfs in the frontolateral electrode regions (F7, F8) is conspicuously absent in the pdfs of their surrogates, indicating non-random phase correlations. Note other electrode regions produced.

