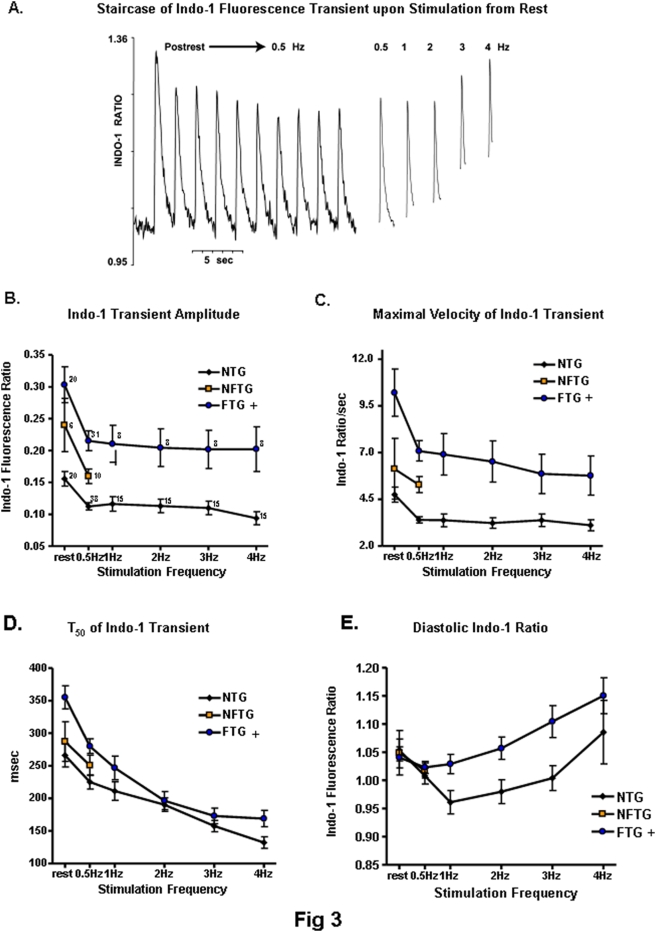
Figure 3. Changes in Ca2+ transient and decline in response to an increase in frequency.
(A) Original representative recording showing Indo-1 fluorescence (410/490) transients in response to electrical stimulation following a two-minute rest and during steady state stimulation at 0.5 to 4 Hz in FTG. (B) Calcium transient amplitude, (C) maximal velocity of Ca2+ transient upstroke, (D) time to 50% decay (T50) and (E) diastolic ratio in Indo-1 loaded mouse ventricular cardiomyocytes. + ANOVA across all stimulation rates P<0.01 vs NTG

