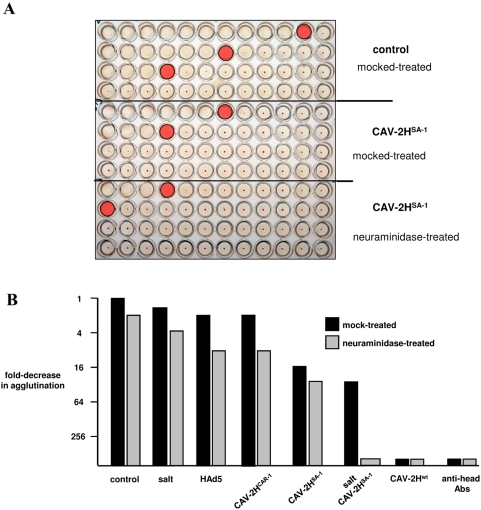
Figure 5. CAV-2 hemagglutination assays using competition with fiber heads, ± increased salt concentrations and ± neuraminidase.
A. Examples of the results from competition assay (see Figure S4 for the schema of the approach). The pink shaded well corresponds to the last well that shows agglutination. A shift to the left of the pink shade signifies decreased agglutination due to blocking of the virus binding site or removal of an attachment ligand. A 2-fold decrease in agglutination would correspond to a one-well shift to the left of the last well that showed agglutination. Top control panel = agglutination of human erythrocytes by CAV-2 (for example ∼8 pp/erythrocyte in the pink shaded well on top row). Middle panel = erythrocytes preincubated with CAV-2HSA−1 (the CAV-2 fiber head that contains a mutation in the sialic acid binding site but can still bind CAR) prior to the agglutination assay (∼96 pp/erythrocyte in the pink shaded well, top row), which equals an ∼8 to 16-fold decrease from the control). Bottom panel = the same as the middle panel except that the erythrocytes were pretreated with neuraminidase (16 to 32-fold decrease). B. The graph shows the cumulative data from competition assays. CAV-2- agglutination of mock-treated erythrocytes was used as the starting point. The blocking agent was used with mock (black bars) or neuraminidase-treated (grey bars) erythrocytes. All assays were performed at least three times.

