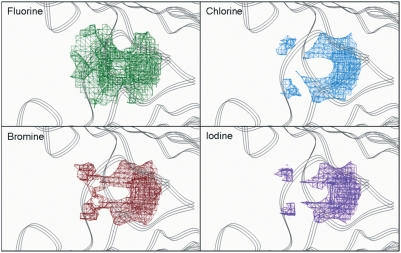
Figure 2. Affinity grids for the different halogens in TTR binding site.
Contour maps are drawn at the highest level in which the HBP regions are showed: −0.8 kcal/mol for fluorine (upper left), −2.8 kcal/mol for chlorine (upper right), −3.6 kcal/mol for bromine (bottom left) and −5.2 kcal/mol for iodine (botom right). The contouring of the maps has been done at different levels of energy to emphasize that que energy interaction values increases with the atomic number of the halogen.

