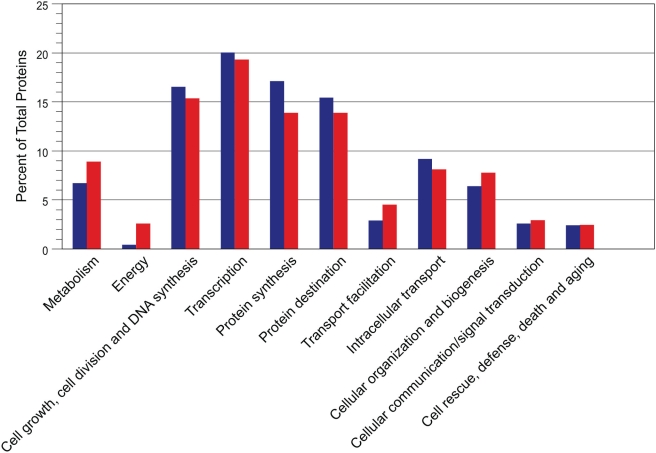
Figure 3. Grouped bar graph showing the distribution percentages of E. bieneusi (blue) and E. cuniculi (red) proteins among the functional categories.
E. bieneusi proteins (653 proteins) were assigned to one of eleven functional categories listed in Katinka et al. [25]. For comparison, the distribution percentages of the E. cuniculi proteins (884 proteins) were included [25]. The corresponding gene lists for both organisms are presented in Table S4.

