Figure 2.
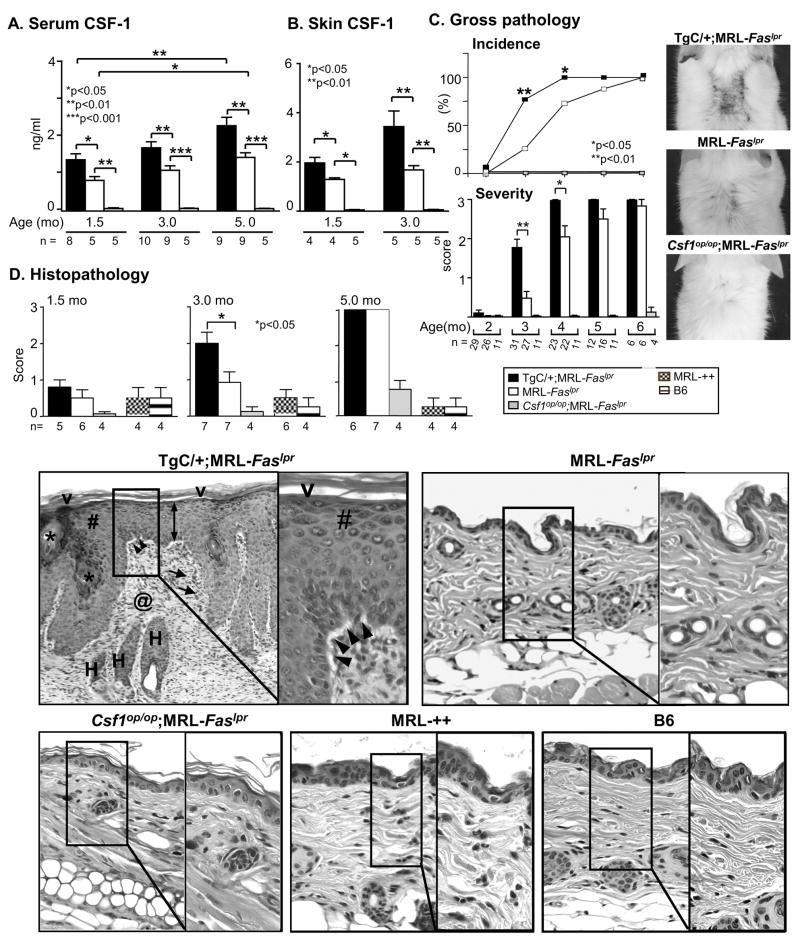
Increasing CSF-1 expression in MRL-Faslpr mice accelerates the tempo of CLE. A. Serum CSF-1 levels in TgC/+;MRL-Faslpr, MRL-Faslpr and Csf1op/op;MRL-Faslpr mice at 1.5, 3.0, 5.0 mo of age and B. Skin CSF-1 levels in homogenates determined by ELISA. C. Time-related incidence and severity of skin lesions in TgC/+;MRL-Faslpr, MRL-Faslpr and Csf1op/op;MRL-Faslpr mice from 2–6 mo of age. Values are mean ± SEM. Representative photomicrographs from MRL-Faslpr at 3 mo of age. D. Skin (intrascapular) histopathology comparing TgC/+;MRL-Faslpr, MRL-Faslpr and Csf1op/op;MRL-Faslpr mice. MRL-++ and B6 mice with normal skin are controls. The cutaneous lesions in TgC/+;MRL-Faslpr mice include: interface vacuolar changes (black arrowheads), acanthotic epidermis (double arrow) with hyperkeratosis (V), hypergranulosis (#) and follicular plugging (*), superficial and deep, as well as perifollicular inflammatory infiltrates (arrows) and dermal scarring (@); Representative skin H&E stained sections (3 mo of age). Magnification: 20x, Inset 40x.

