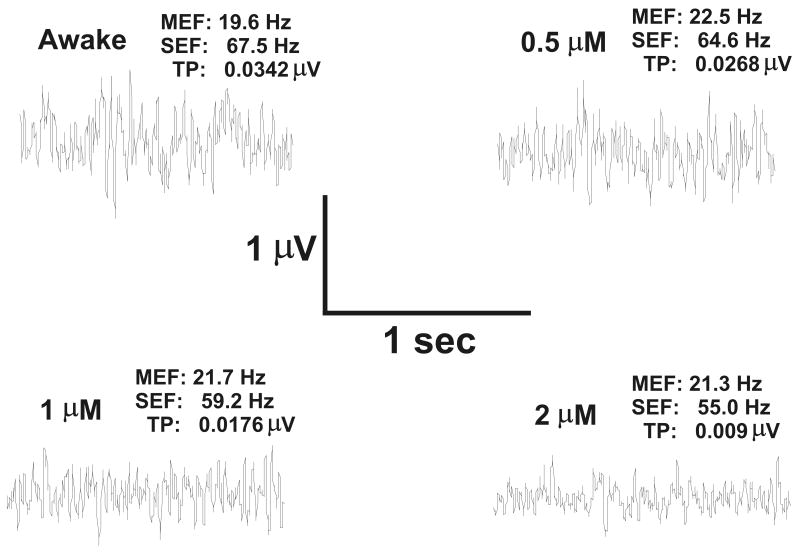
Figure 4.
Effect of etomidate on the electrocortigogram (ECoG). The ECoG is shown for waking and at 0.5 μM, 1 μM and 2 μM etomidate. Etomidate action was modeled using phasic and tonic inhibition. Note that increasing etomidate concentration results in decreased spectral edge frequency (SEF), decreased total power (TP) and little change in median edge frequency (MEF).

