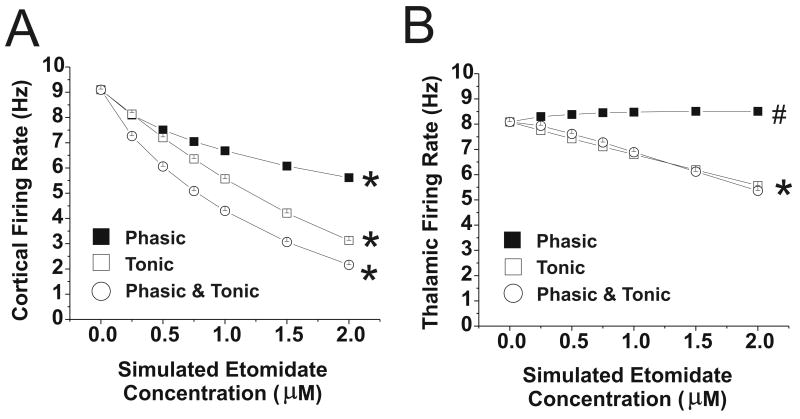
Figure 5.
Cortical and Thalamic Firing rates with changes in GABAergic input with etomidate. Data are shown for phasic or tonic GABAergic inhibition (or both), applied to thalamus and cortex at simulated etomidate concentrations 0-2 μM. (A) Cortical firing rate; *=values at each etomidate concentration different from all other values, p<0.001. (B) Thalamic firing rate; *=Phasic and combined Phasic and Tonic values at each etomidate concentration different from all other values, p<0.001; # =values at each etomidate concentration different from all other values, p<0.05, except that value at 1 μM is not significantly different from value at 2 μM. Note that when only phasic inhibition is applied thalamic firing rate increases slightly.

