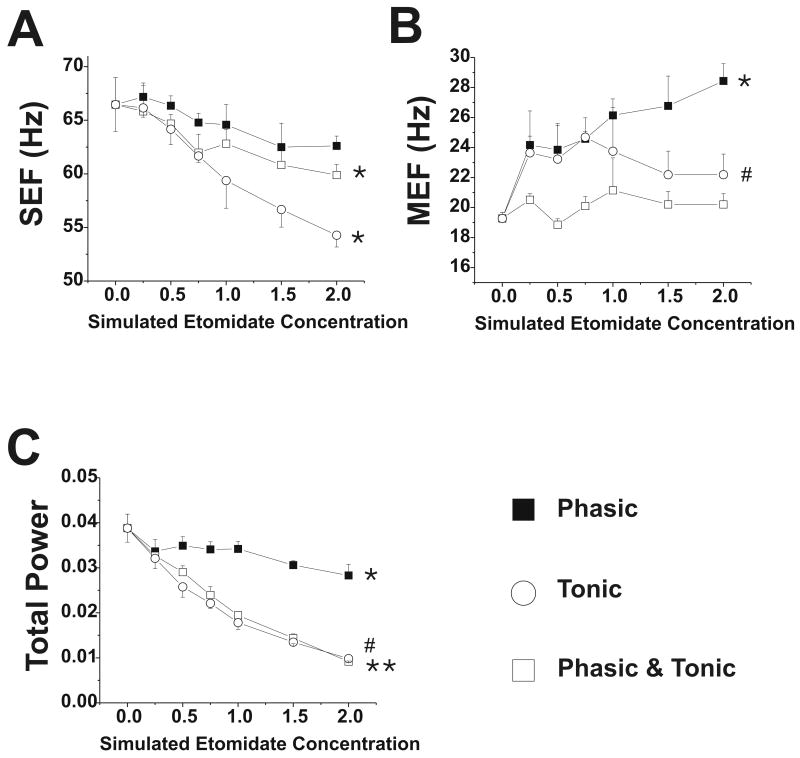
Figure 6.
Electrocorticogram parameters with changes in GABAergic input with etomidate. Data are shown for phasic, tonic and combined phasic and tonic GABAergic inhibition at simulated etomidate concentrations 0-2 μM. (A) Spectral edge frequency, SEF; * = p<0.05 for values at 0.75-2 μM compared to awake value; (B) Median edge frequency, MEF; * = p<0.05 for values at 0.25-2 μM compared to awake value; # = p<0.05 for 0.75 μM value compared to awake value (C) Total power; *, #, ** = p<0.05, p<0.01 and p<0.001 for values at 0.25-2 μM compared to awake value.

