Figure 1.
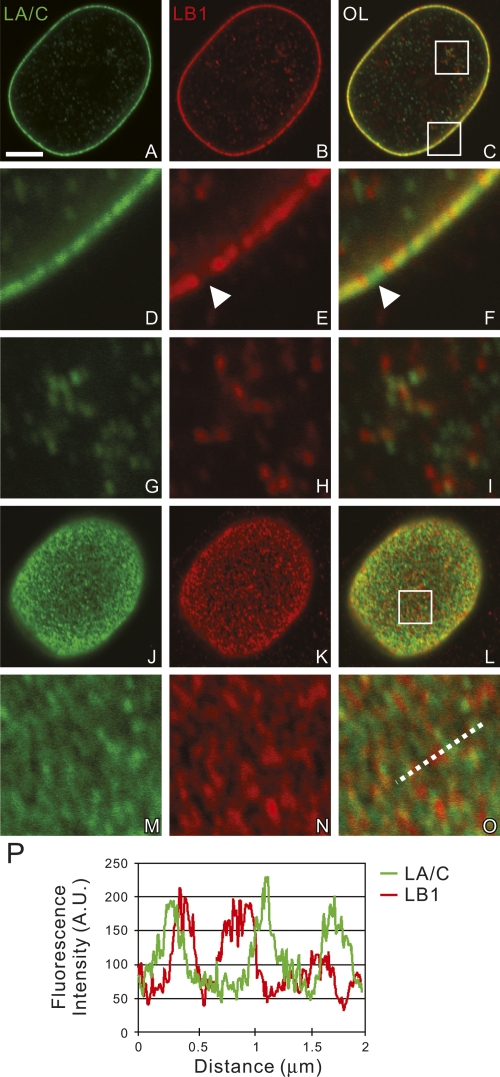
The distributions of LA/C and LB1 were determined by double-label confocal immunofluorescence. LA/C (green) and LB1 (red), from a single nucleus are seen in an equatorial section (A–I) and the nuclear surface (J–O). The areas indicated by white squares in C and L are enlarged fivefold in D–I and M–O, respectively. (P) A line scan showing the fluorescence intensity profile along the dotted line in O. These images demonstrate that lamins form mainly separate networks with some overlapping regions. Bar, 5 μm.

