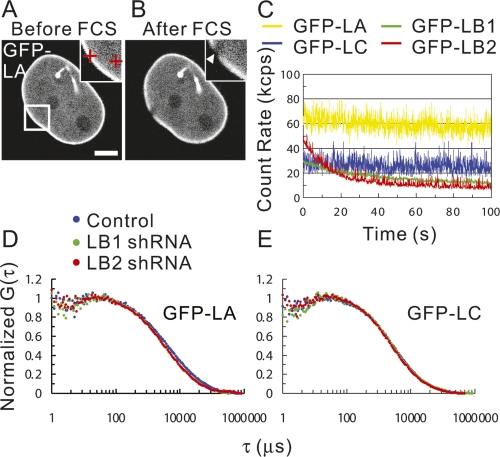
Figure 4.
The mobilities of GFP-LA, LB1, LB2, and LC in live HeLa cells were measured by FCS. Fluorescence images of GFP-LA before and after FCS measurements are shown in A and B, respectively. Cross-hairs in the inset in A represent points measured by FCS. An arrowhead in the inset in B indicates the zone within the lamina bleached during FCS measurement. Bar, 5 μm. (C) Representative fluorescence fluctuations of GFP-LA, LB1, LB2, and LC in the nucleoplasm plotted as a function of time (yellow line for GFP-LA, blue line for GFP-LC, green line for GFP-LB1, and red line for GFP-LB2). (D,E) Note that LB1 and LB2 are rapidly photobleached. Mobilities of GFP-LA and LC in LB1 and LB2 silenced cells were measured by FCS. Averaged normal fluorescence autocorrelation curves of GFP-LA and GFP-LC in the nucleoplasm of control, LB1, and LB2 silenced cells were calculated from the fluorescence fluctuations and plotted as a function of correlation time τ (in microseconds) (blue dots for control cells, green dots for LB1 silenced cells, and red dots for LB2 silenced cells). G(τ) is the fluorescence autocorrelation function.

