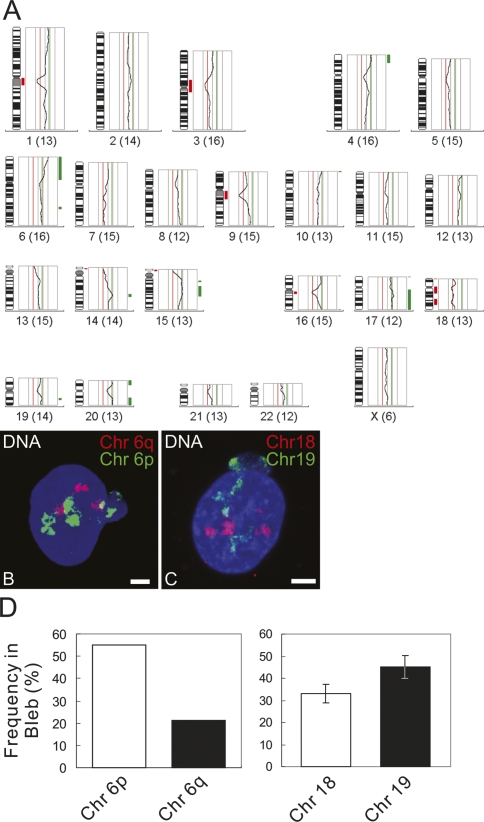
Figure 7.
(A) CGH profile from a pool of 20 blebs from LB1 silenced cells. The fluorescent intensities of the green and red channels are depicted as an intensity ratio profile next to each chromosome. Regions that are overrepresented in nuclear blebs are indicated by a green bar, and regions that are underrepresented are indicated by a red bar. Note the underrepresentation of regions of chromosome 18 and the overrepresentation of 6p, regions of chromosome 17, and regions of chromosome 19. (B,C) Chromosome distributions in LB1 silenced cells. DNA is counterstained with Hoechst 33258. DNA, chromosome 6p (or 19), and chromosome 6q (or 18) are shown in blue, green, and red, respectively. Bars, 5 μm. (D) Percentiles of the distributions of painting probes for 6q/6p and 18/19 in LB1 silenced cells with nuclear blebs. Error bars are ±SD.

