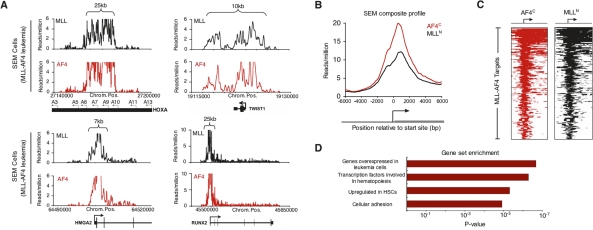
Figure 2.
MLL-AF4 target genes are enriched for early developmental regulators. (A) Signals for AF4 (red) and MLL-N (black) reflecting binding of the presumptive MLL-AF4 fusion protein in SEM cells as determined by ChIP-seq. Binding profiles are shown across a 15- to 150-kb portion of the genome surrounding the HOXA9, TWIST1, HMGA2, and RUNX2 genes (gene models shown in black below graph; a black arrow indicates transcription start sites). Size of MLL-AF4-enriched region is indicated by top brackets. A detailed description of data analysis methods is provided in the Supplemental Material. (B) Composite AF4-C terminus (red) and MLL-N terminus (black) binding profiles for all MLL-AF4 target genes. The start site and direction of transcription of the average gene are indicated by an arrow. (C) ChIP-seq density heat map of AF4-C terminus (red) and MLL-N terminus (black) for all MLL-AF4 target genes. The genomic region from −5kb to +10kb relative to the transcription start site of each gene is shown. Gene order is determined by highest average MLL/AF4 read density from top to bottom. The start site and direction of transcription of the genes are indicated by an arrow. (D) Selected results of GSEA (http://www.broad.mit.edu/gsea) of MLL-AF4 target genes .

