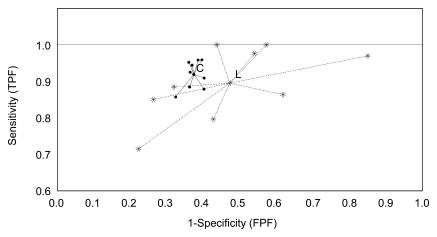
Graph shows measured performance levels (sensitivity [true-positive fraction, TPF] and 1 − specificity [false-positive fraction, FPF]) and overall average performance (center points) for reader-specific sets of mammograms in the clinic (C) and laboratory (L). The differences in performance levels and dispersion (spread) among the nine radiologists in the clinic and in the laboratory are demonstrated.

An official website of the United States government
Here's how you know
Official websites use .gov
A
.gov website belongs to an official
government organization in the United States.
Secure .gov websites use HTTPS
A lock (
) or https:// means you've safely
connected to the .gov website. Share sensitive
information only on official, secure websites.
