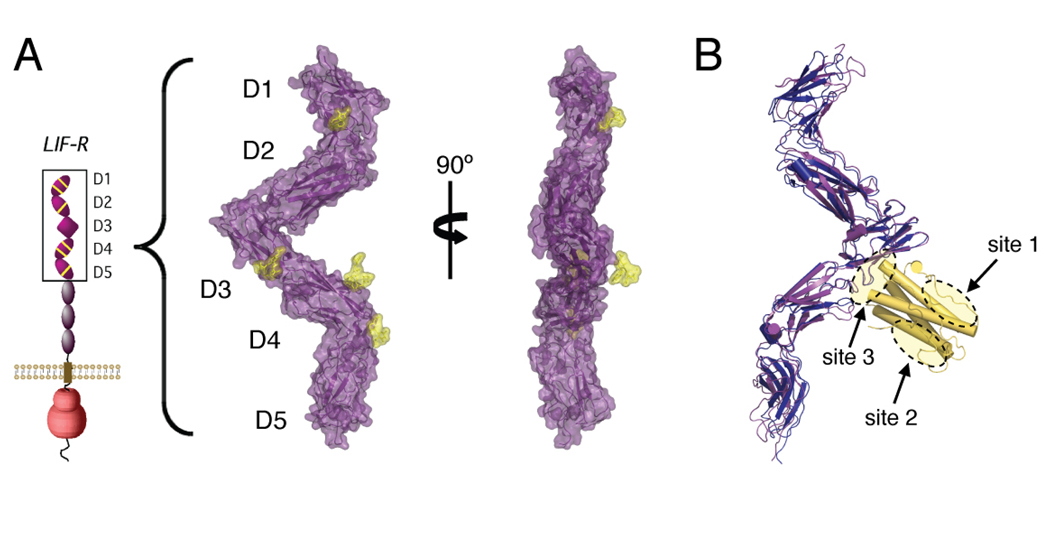
Figure 2. Structure of unliganded LIF-R and comparison with the LIF-R/LIF complex.
(A) Surface representations of unliganded human LIF-R D1-D5. Sugar residues modeled into the structure are colored yellow. (B) Overlay of human LIF-R onto mouse LIF-R/LIF structure. The D3 Ig domain of human LIF-R (purple) was aligned with the D3 Ig domain of mouse LIF-R (blue), with the cytokine LIF shown in gold. Receptor interaction sites 1, 2, and 3 on LIF-R are circled.

