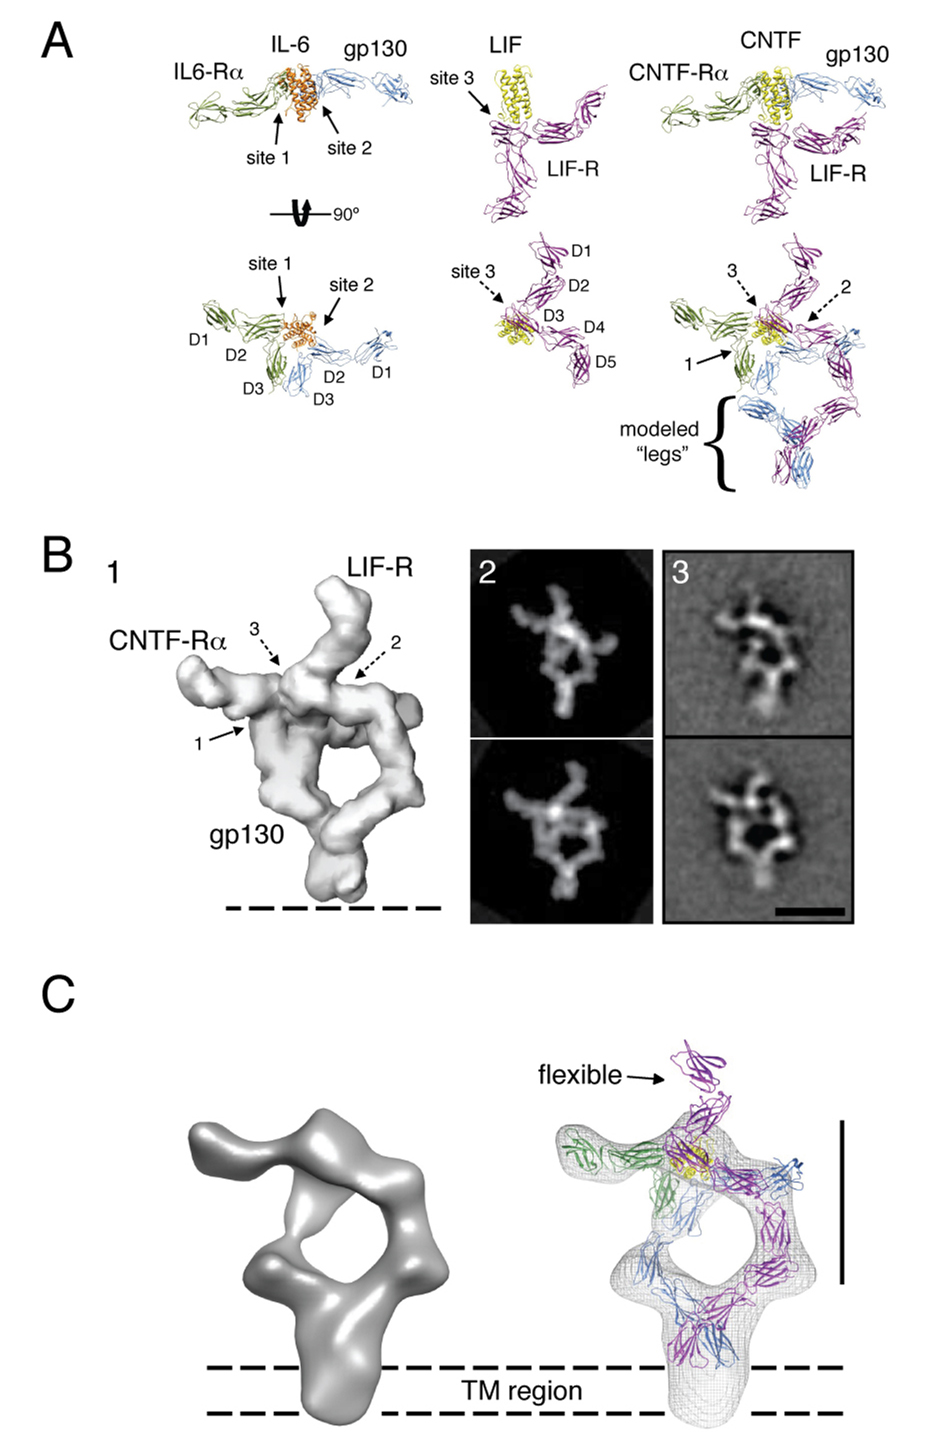
Figure 5. Architecture of the gp130/LIF-R/CNTF-Rα/CNTF complex.
(A) The 3D structure of the ectodomain ‘headpiece’ of the gp130/LIF-R/CNTF-Rα/CNTF complex was modeled based on the crystal structures of gp130/IL-6Rα/IL-6 and the LIF-R/LIF complexes. The gp130 and LIF-R ‘legs’ (D4-D6 and D6-D8, respectively) were modeled according to the densities observed in the 2D EM averages as shown in Figure 3C (gp130: blue, IL-6Rα: green, IL-6: orange, LIF-R: magenta, LIF: yellow, CNTF-Rα: green, CNTF̣: yellow). (B) The model of the full extracellular gp130/LIFR/CNTF-Rα/CNTF complex was filtered to 30Å resolution (panel 1), and was subsequently used to generate projections at regular angular intervals. The projections (panel 2) most similar to the experimental 2D averages were identified by cross-correlation against two of the most representative class averages (panel 3). (C) 3D reconstruction of the gp130/LIF-R/CNTF-Rα/CNTF complex and fit crystal structures. The 3D map shows clearly density corresponding to the transmembrane region of gp130/LIFR below the level of the C-terminal extracellular domains. The scale bars in B and C are 20 nm.

