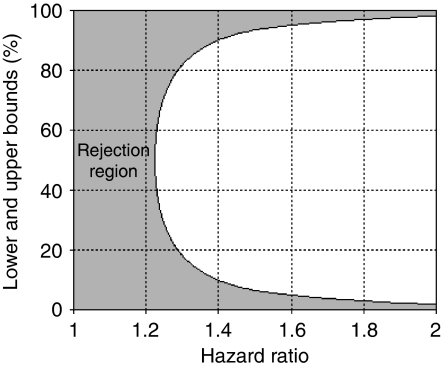
Figure 1.
Lower and upper bounds calculated at 80% power, α=0.05, overall death rate d=0.6, and total sample size N=1000 for comparison with mutation rate estimated from n (n⩽N) patients. The shaded area represents the rejection region. A 95% confidence interval of mutation rate from n patients falling completely within this region suggests that the marker has little variability and likely insufficient power to predict survival, even if all data from N patients were collected.

